Connect patients, clinics, and hotspots
Materialize the ontology and inspect relationships between public-health data and regions.
Question for this chapter
How can patients, clinics, and hotspots from separate tables be viewed in one regional context?
Why this matters now
Columns alone require repeated joins to answer which patient relates to which hotspot and where that place belongs. An ontology represents subjects as nodes and the meaning of connections as relations.
Try it
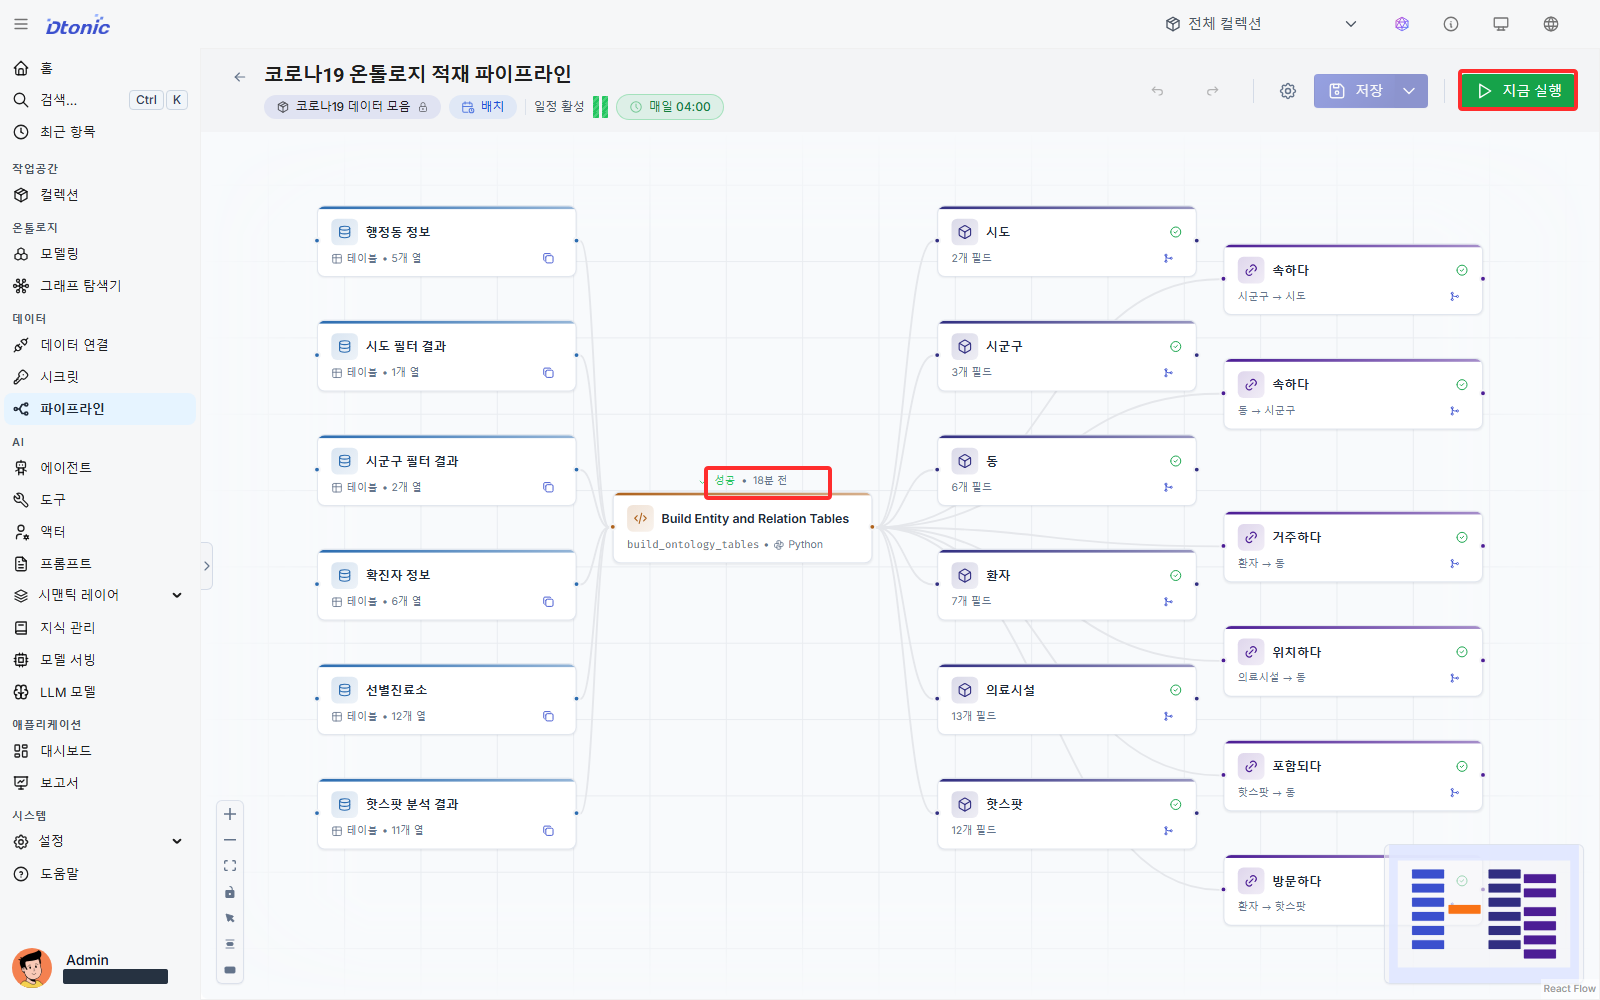
Open COVID-19 Ontology Materialization Pipeline under Pipelines and select Run now. Wait for the central code stage and the complete run to succeed.
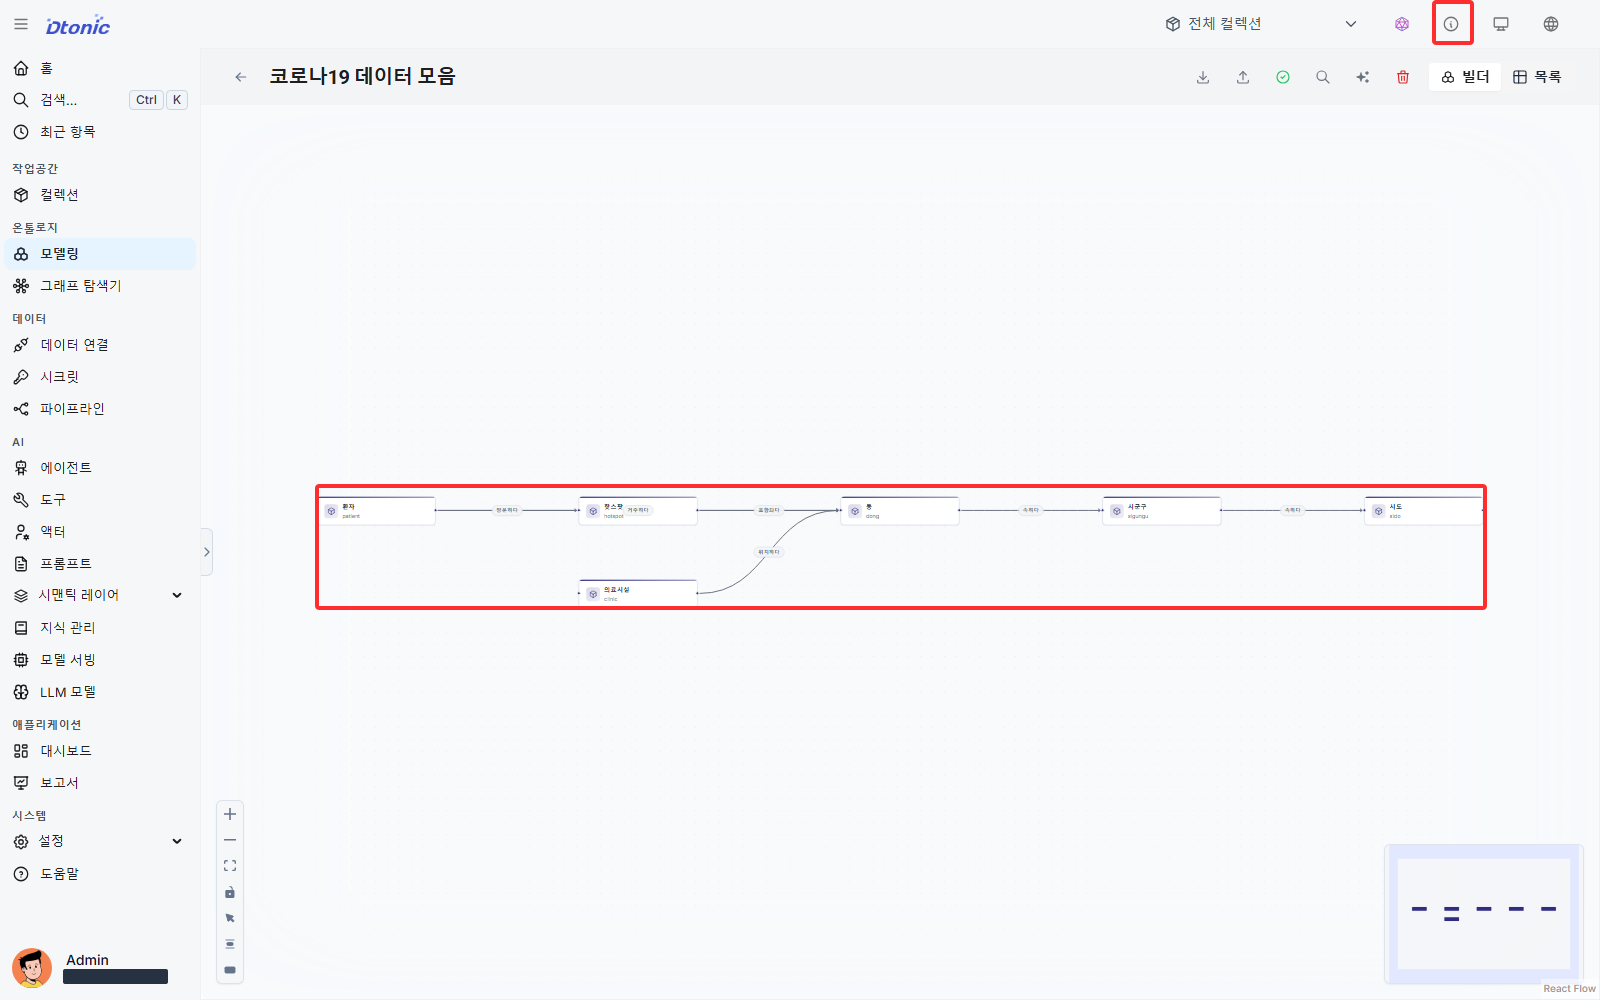
Open COVID-19 Data Collection under Modeling and inspect its entities and relations.
Success looks like this
The model contains Patient (patient), Clinic (clinic), Hotspot (hotspot), Dong
(dong), Sigungu (sigungu), and Sido (sido), plus involved_in, within, resides_in,
located_in, belongs_to, and belongs_to_sido.
Interpret the result
patient → hotspot → dong represents a movement-intersection place, clinic → dong represents
clinical access, and dong → sigungu → sido expands an observation into a wider administrative context.
| Path | Analysis question | Example use |
|---|---|---|
patient → resides_in → dong | Where does the patient live? | Resident-based patient distribution |
patient → involved_in → hotspot → within → dong | Where did patient movements intersect? | Patients connected to a shared place |
clinic → located_in → dong | Which clinical resources are in the dong? | Conditions for further testing and review |
dong → sigungu → sido | Which higher region contains this observation? | Sigungu- or sido-level reporting |
Changing the starting node changes the question without manually rebuilding every join. Start from a patient to trace movement; start from a dong to expand all related patients and facilities.
Next decision
The relationships are ready. Start at one dong, expand related patients and hotspots, then follow the path to higher regions.