Data engineer's main work areas
What you will learn
The four surfaces engineers use in portal — Connectors, Pipelines, Codes, Datasets — mapped against dbt and Airflow, plus what this path builds.
Analysts draw screens on top of data that already exists. Engineers are responsible for how that data got there. In portal that responsibility splits across four surfaces, and the endpoint of all four is always a single artifact: a dataset.
Four surfaces an engineer lives in
- Data Connection — The entry points wiring portal to external systems like databases, S3, and REST APIs. Addresses and authentication are defined here; browsing tables, mapping schemas, and creating datasets are not.
- Pipelines — The workflow editor where you connect a collection's datasets, code assets, and transform nodes into one flow.
- Codes — Python or SQL assets. Called from a code node inside a pipeline, or runnable on their own.
- Datasets — Where the outputs of the surfaces above land. At the same time, they are the inputs of the Analyst Path.
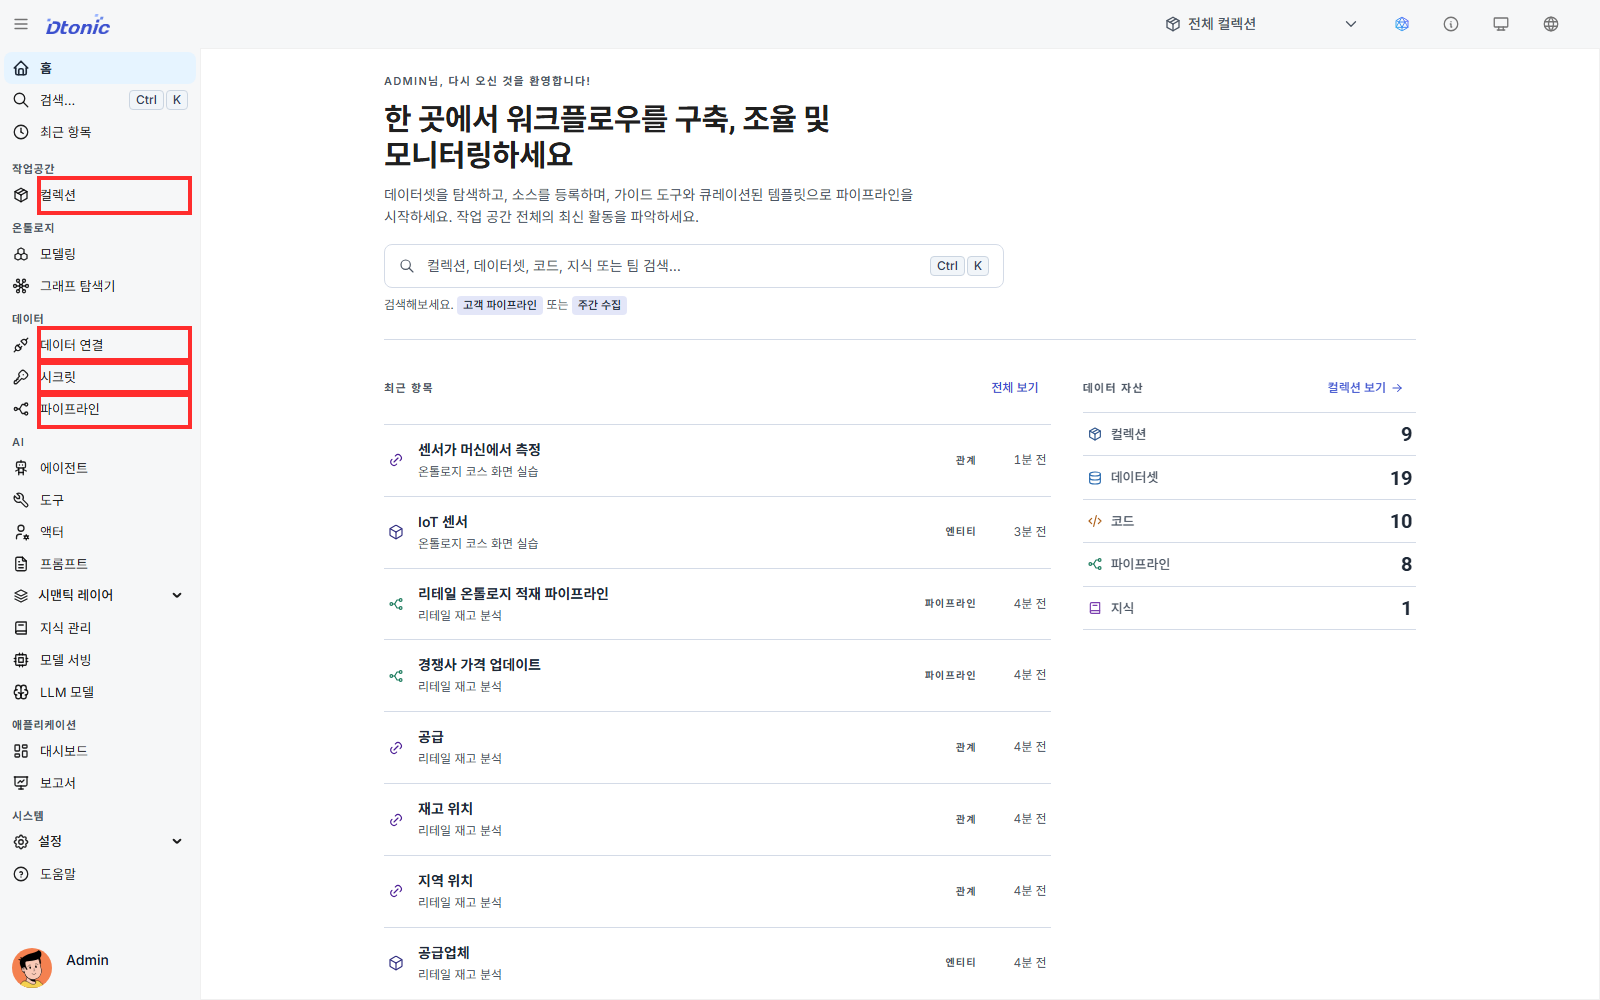
The key idea is that the endpoint of all four surfaces is always a dataset. The dataset the engineer produces shows up directly in the analyst's collection tree and feeds into widgets. The boundary between the two roles meets at the dataset.
What this path builds
Rather than touring the four surfaces separately, this path carries one subject all the way through: a public weather API. It returns hourly temperature and humidity for a coordinate without authentication, so there is no signup or key to obtain before you start.
Each lesson adds one thing.
| Lesson | What gets added | What it leaves behind |
|---|---|---|
| 02 | A data connection | The open_meteo connector |
| 03 | A code node and the first pipeline | The src_weather_hourly dataset |
| 04 | Polars cleanup and daily aggregation | prepare_weather_daily, stg_weather_hourly, mart_weather_daily |
| 05 | A recurring schedule | A batch pipeline that runs daily |
| 06 | Failure diagnosis and handoff | A dashboard chart and settled permissions |
By the end of lesson 06 the training collection holds one connector, three datasets, two code assets, one pipeline, and one dashboard. Nothing built along the way is discarded.
Mapping to tools you already know (one-time only)
If you've run the same flow on dbt, Airflow, or Snowflake before, keep the following table in your head for the first 30 minutes — that's enough to start reading portal. From lesson 02 onward we use portal vocabulary only.
| Tool you know | Corresponding portal surface |
|---|---|
| Airflow Connection · Source definition | Data Connection |
| Airflow DAG | Pipelines |
| dbt model SQL · Python snippet | Codes asset + code/transform node inside a pipeline |
| dbt source/seed/mart table | Datasets |
| Snowflake/BigQuery and other DWHs | The workspace datasets land in (built into portal) |
| GitHub Actions · Cron | Pipeline schedule |
Two notes to set the expectation against your existing stack:
- DAG and models live on the same canvas. Instead of operating Airflow's task graph and dbt's model dependency graph side by side, portal shows input datasets, transforms, and output datasets on one pipeline canvas.
- Tables collapse into one dataset abstraction. The distinction between "source tables" and "mart tables" is expressed through collections, permissions, and tags. The engine type underneath isn't surfaced.
That is also why this path names the raw dataset src_, the cleaned one stg_, and the summary mart_. dbt's source → staging → mart layering is expressed here through dataset names and collections.
This mapping is here to help you decide which surface to open first, not as a claim that portal is a 1:1 replacement for dbt + Airflow.
How analysts and engineers divide the work
For the two roles to share one portal without stepping on each other, you need an explicit handshake about who owns what. A common split looks like this:
| Responsibility | Usually owned by |
|---|---|
| Pulling data from external systems | Engineer |
| Defining dataset schemas and types | Engineer |
| Grouping datasets into collections and granting access | Engineer (or owner) |
| Building widgets and dashboards on top of datasets | Analyst |
| Pushing analysis results back into production systems | Engineer |
The boundary varies by team size — one person often plays both roles in a small organization. This path is written from the engineer side of that line, but the last lesson takes you across it and builds the first chart yourself.
If this is your first time in D.Hub, the 30-minute Essentials Path is worth doing first.
Next lesson
The next lesson opens the first surface — Data Connection — by registering the public weather API as a managed REST connector, testing it, and reading its actual response in the Query Console.
Before you finish
Use these questions to check whether you achieved this lesson's goal.
- Can you repeat ‘Data engineer's main work areas’ without following the instructions?
- Can you name at least one place to check when the result differs from what you expected?