Pipeline build and dashboard visualization
What you will learn
Load and transform raw data, then connect the result to dashboard widgets and complete an operational screen.
This lesson closes the loop from data processing to user-facing operations. You load data into datasets and ontology entities, then wire the output into dashboard widgets.
Review the pipeline list
Open Pipelines from the left sidebar to review the pipelines already registered and their recent update history.
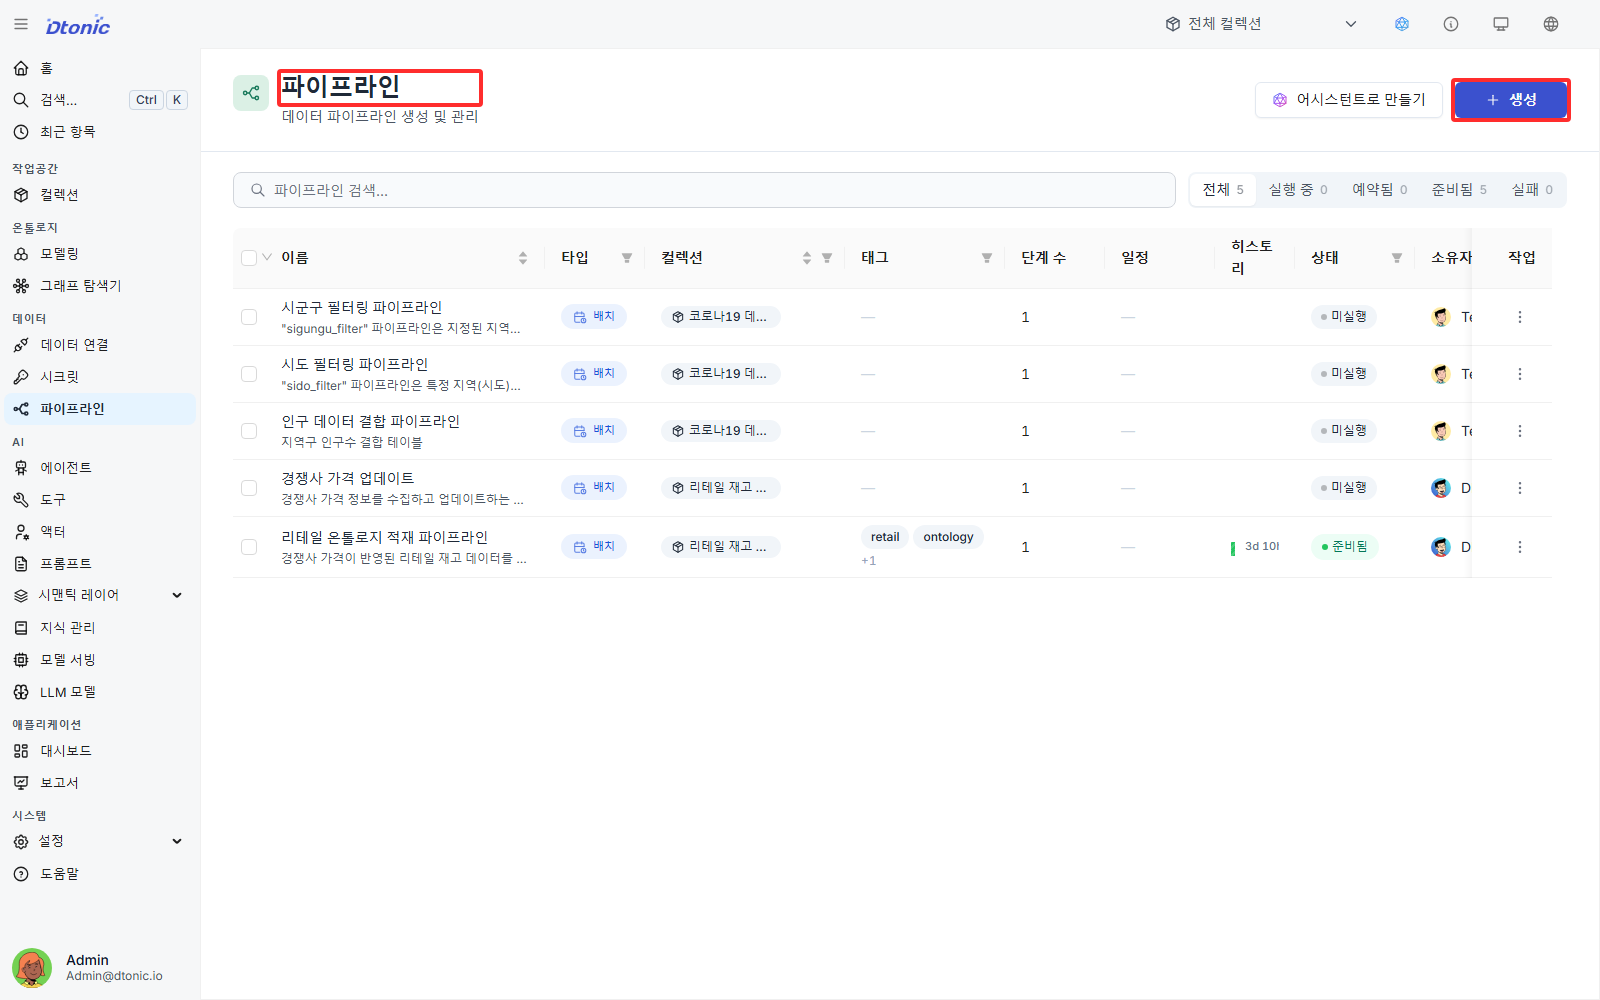
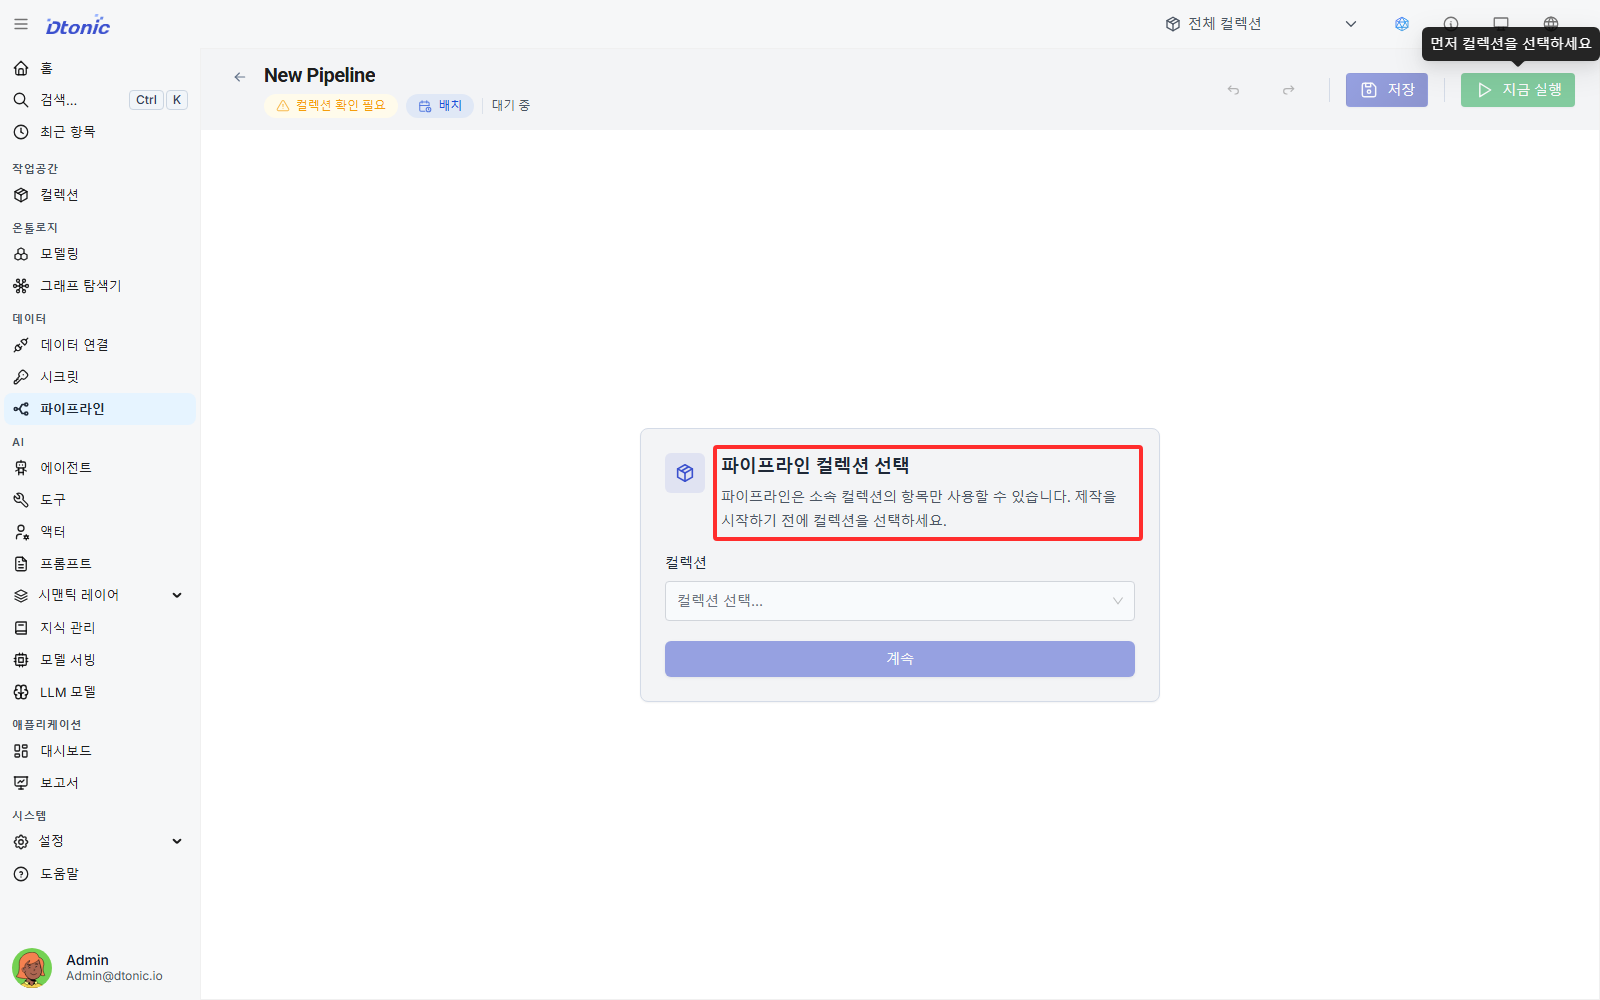
Create a pipeline and map it to a collection
If Collection scope is set to All collections, click Create and then select the target collection. If a specific collection is already in scope, Portal assigns it automatically and opens the Workflow editor without the collection-selection step.
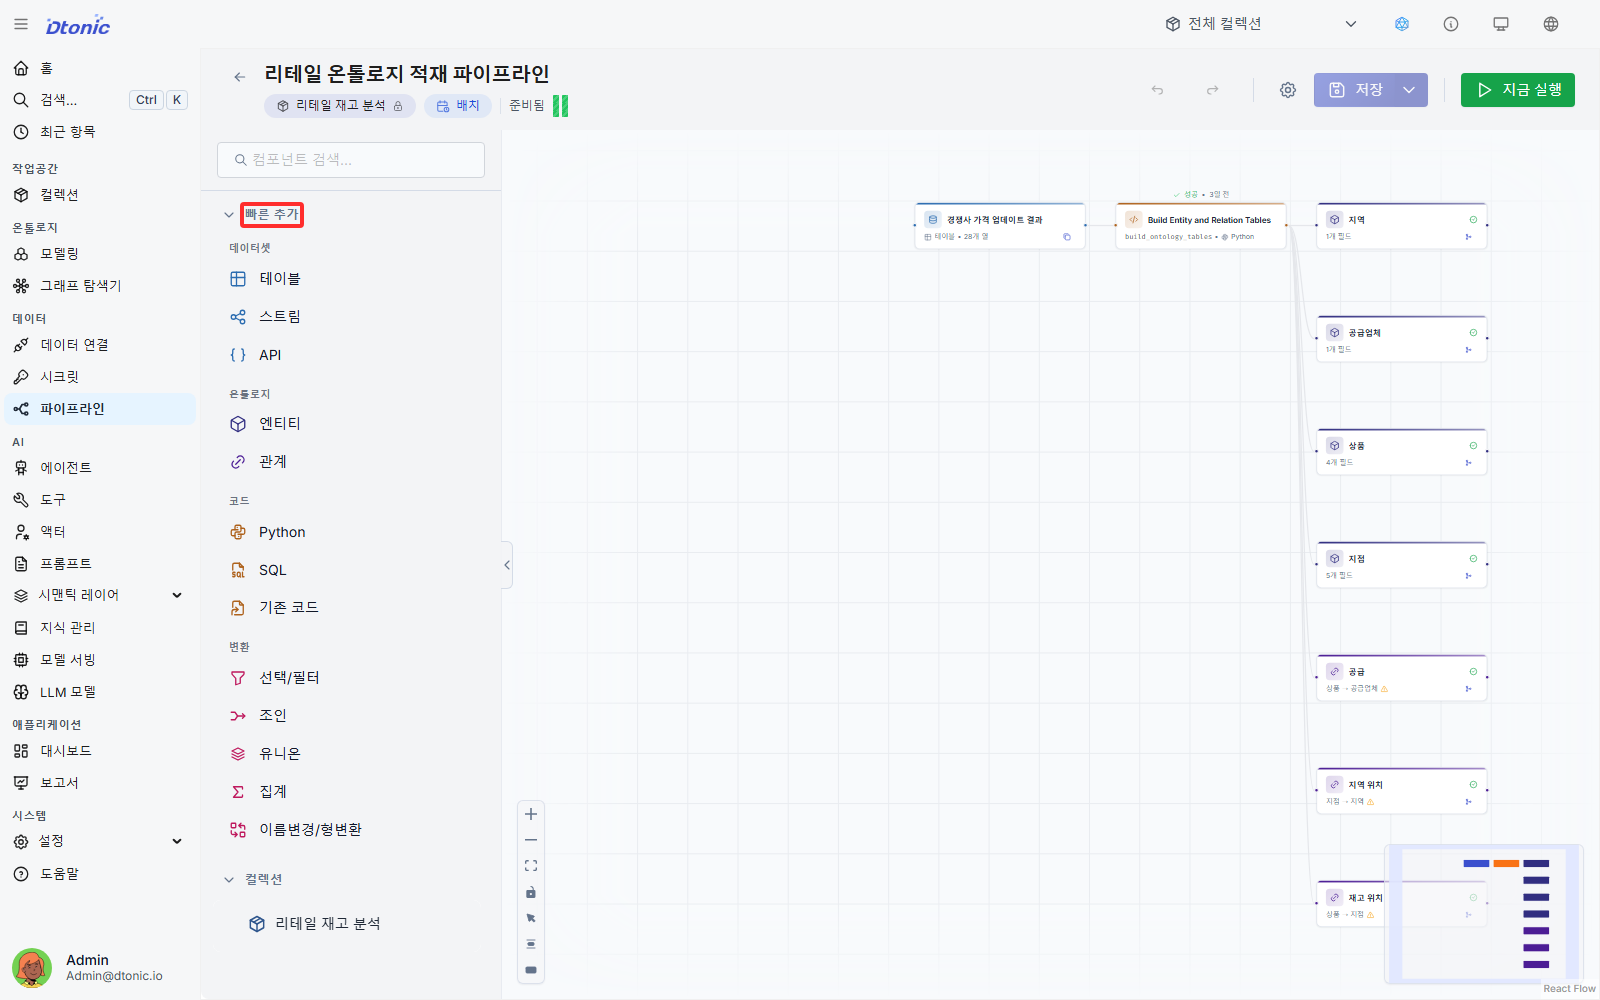
Reuse resources in the pipeline builder
When the Workflow editor opens, you can create datasets or code resources from the left sidebar on the spot, or search for existing datasets, code, and entity resources and place them on the canvas.
Build the workflow
Arrange and connect the nodes into a working pipeline flow.
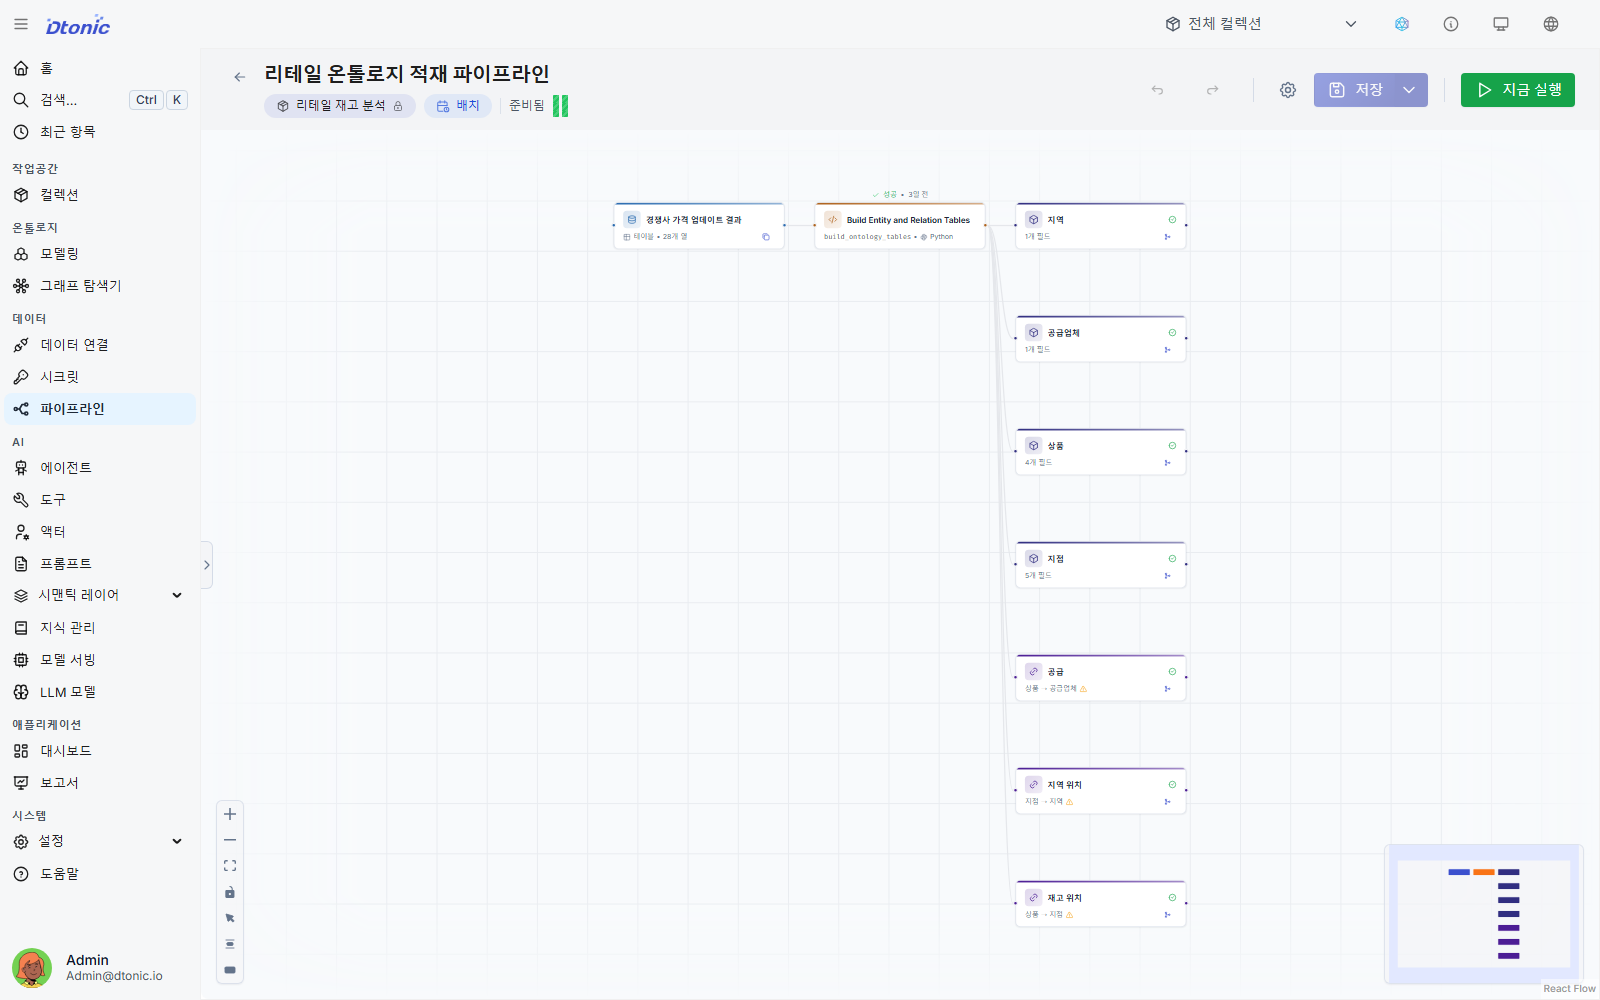
Run the pipeline
Click Run now from the top menu bar to execute the pipeline and start the transformation and load process.
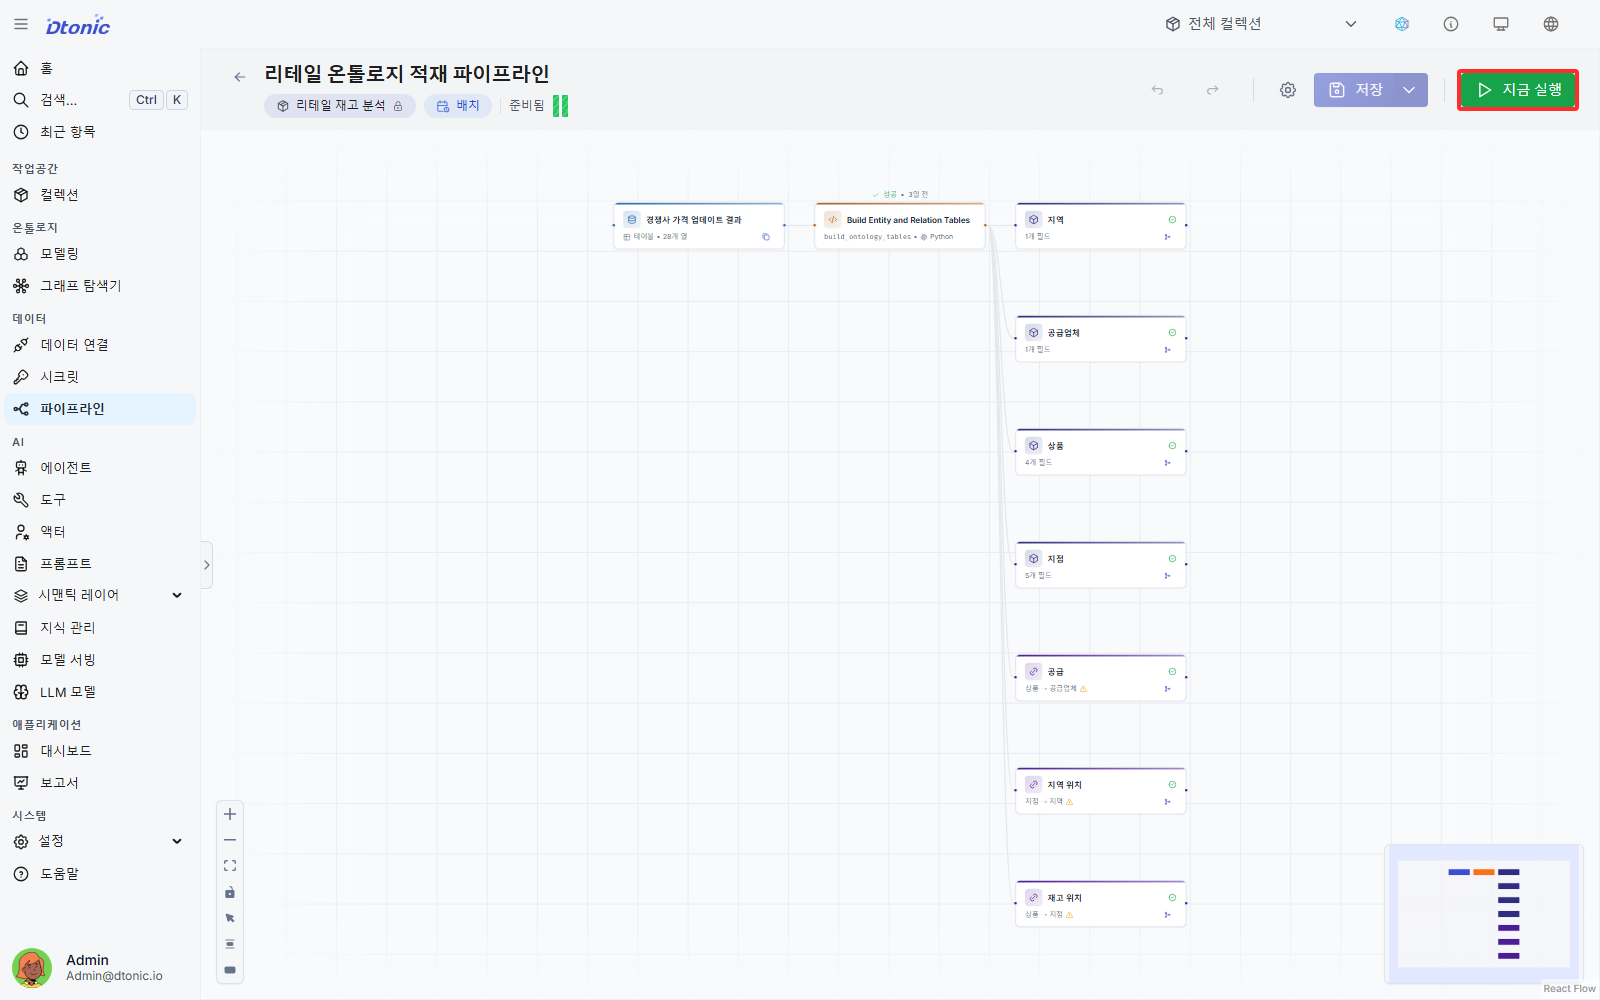
Validate dataset results
After the run finishes, open Datasets inside the collection and confirm that the data was stored correctly in the expected table structure.
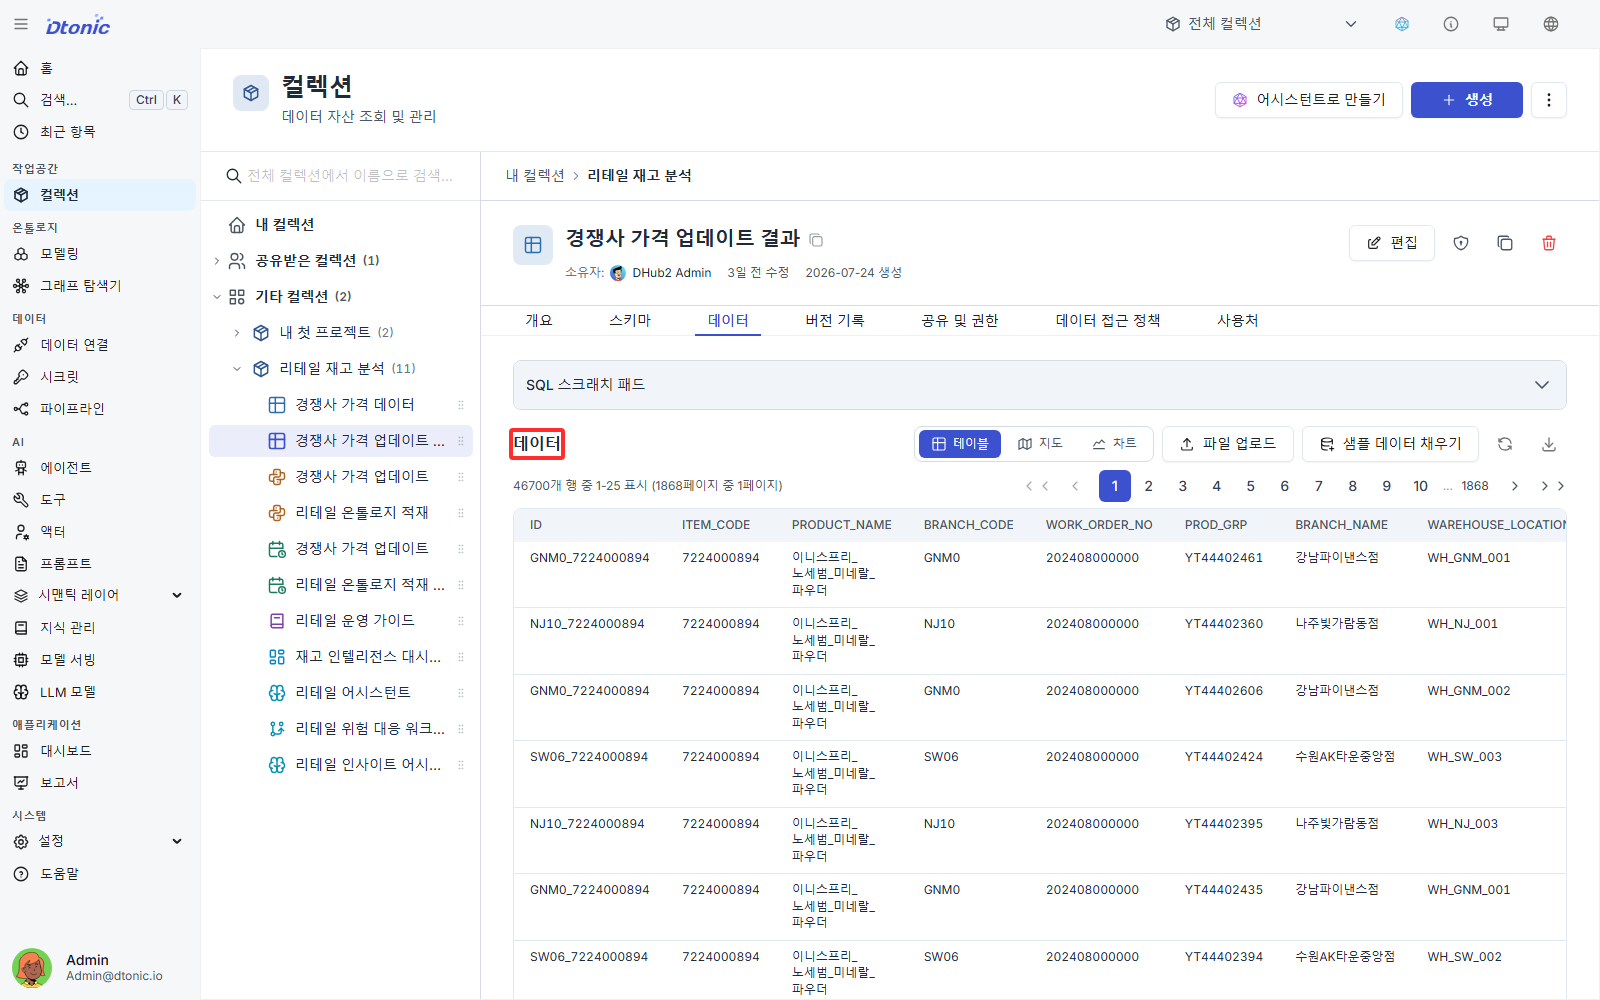
Validate entity load results
Check the ontology entity data as well. Entity data is stored in a transaction-safe area to prevent loss, and it is synchronized in parallel to a query-friendly dataset path for fast access.
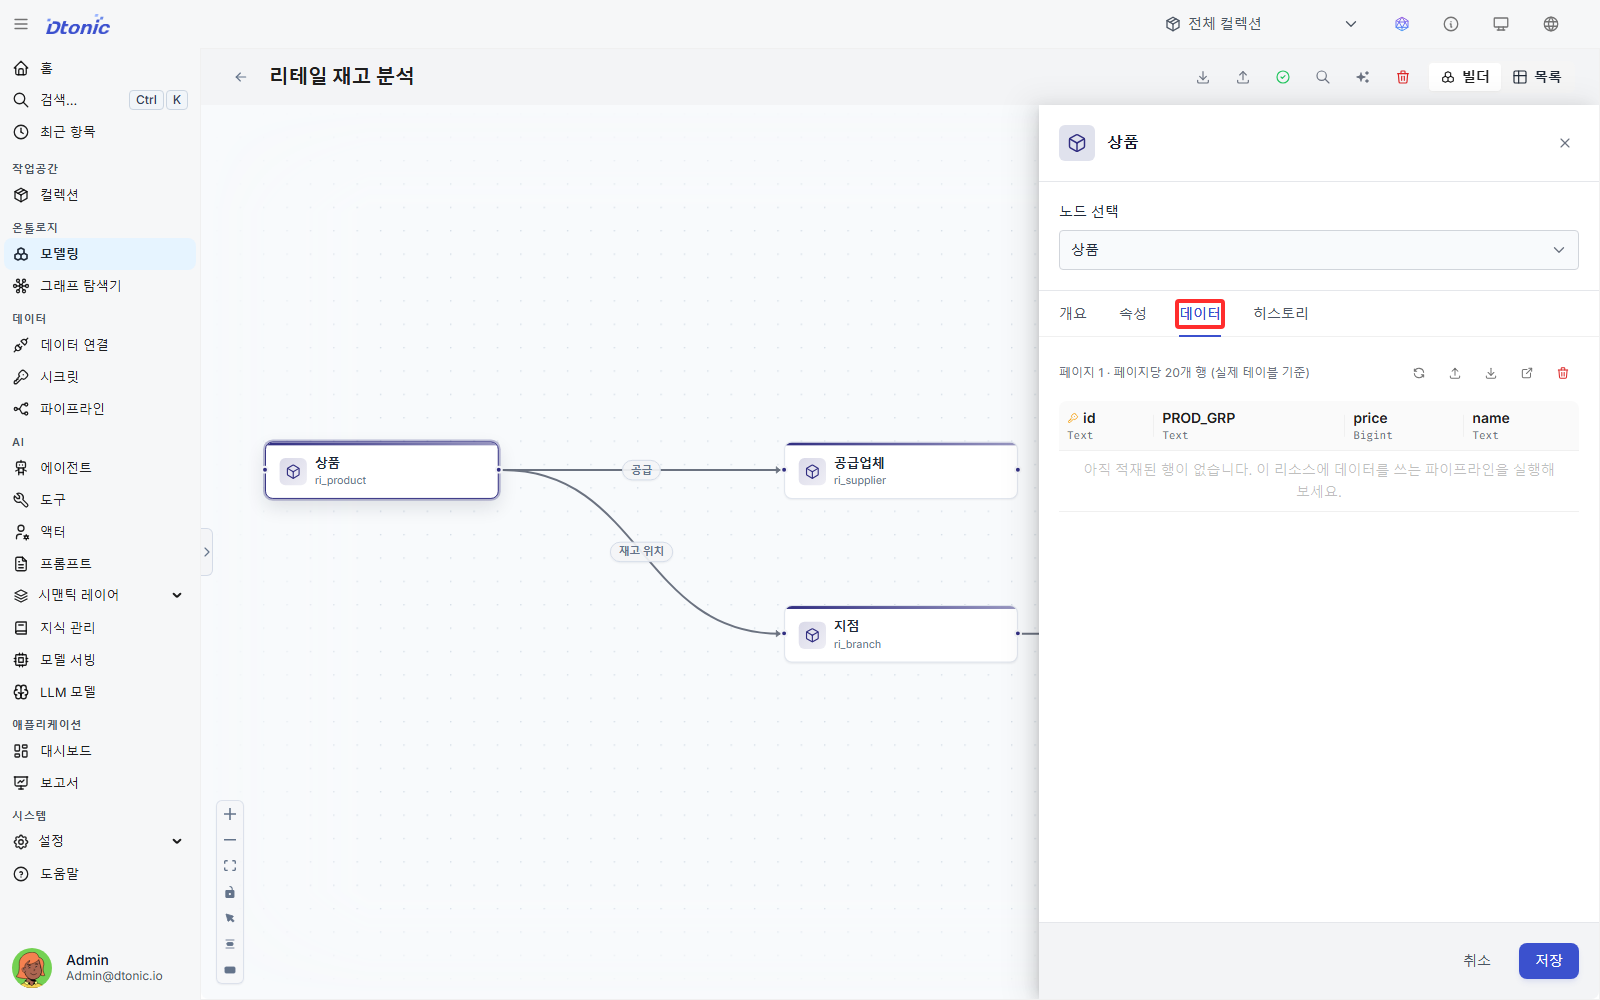
Configure the batch scheduler
Open the Schedule tab in the pipeline save dialog and enable scheduling. Under Schedule type, choose one of the available presets: every minute, hourly, daily, weekly, or monthly.
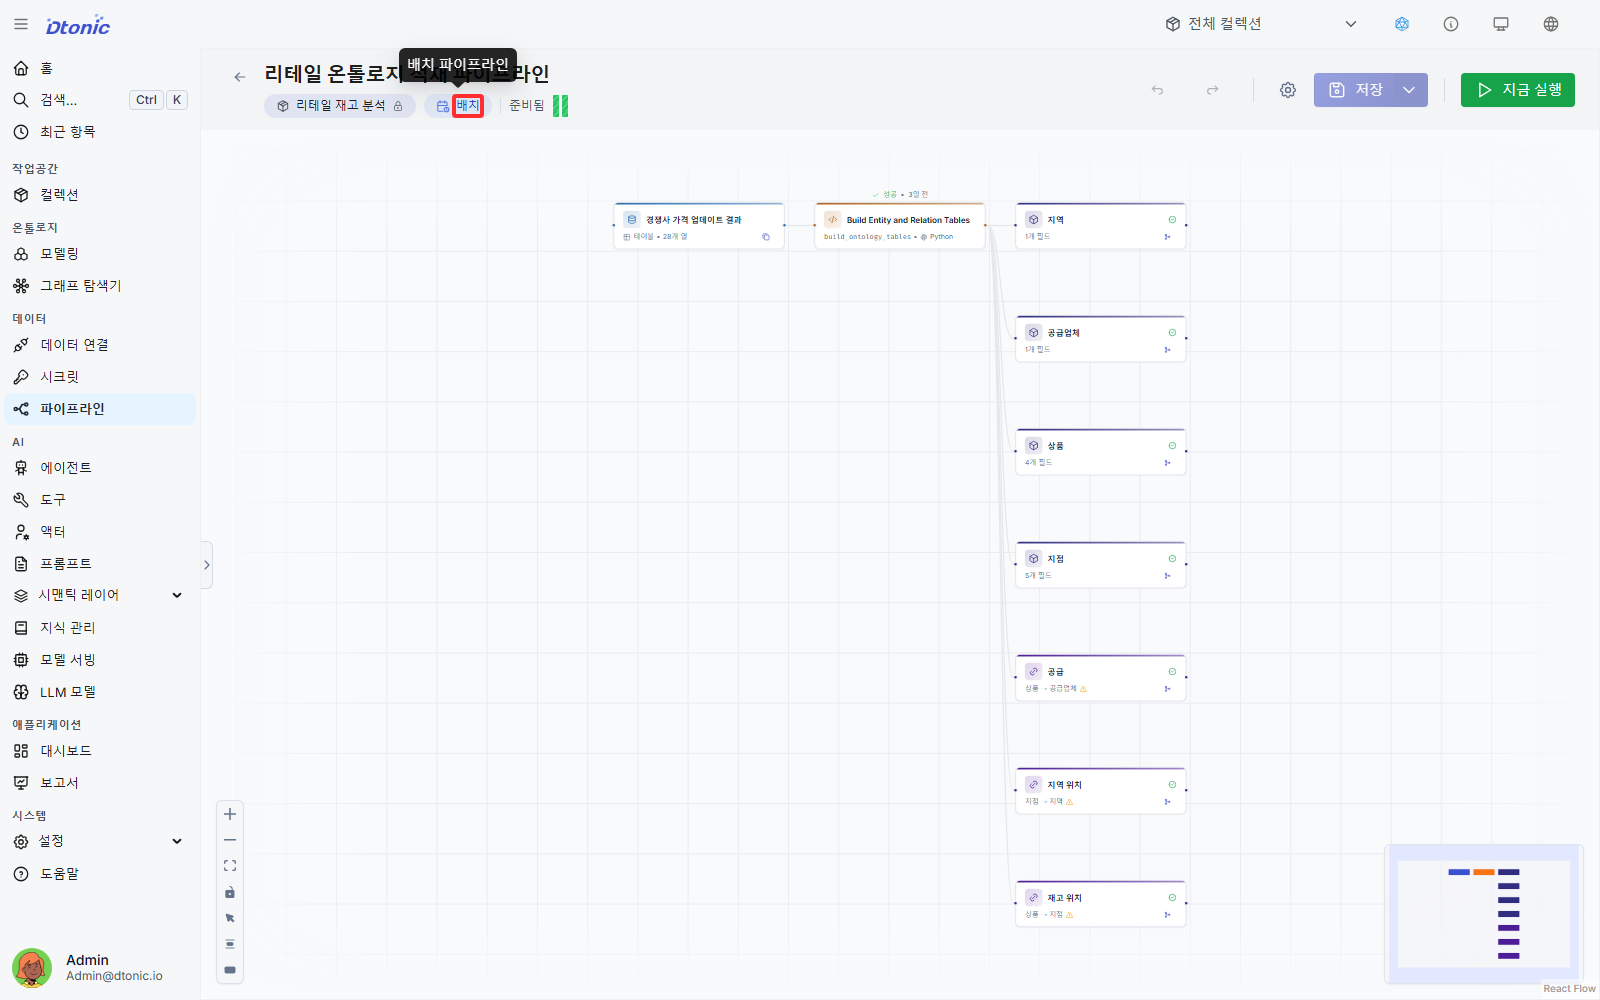
Connect dashboard widgets
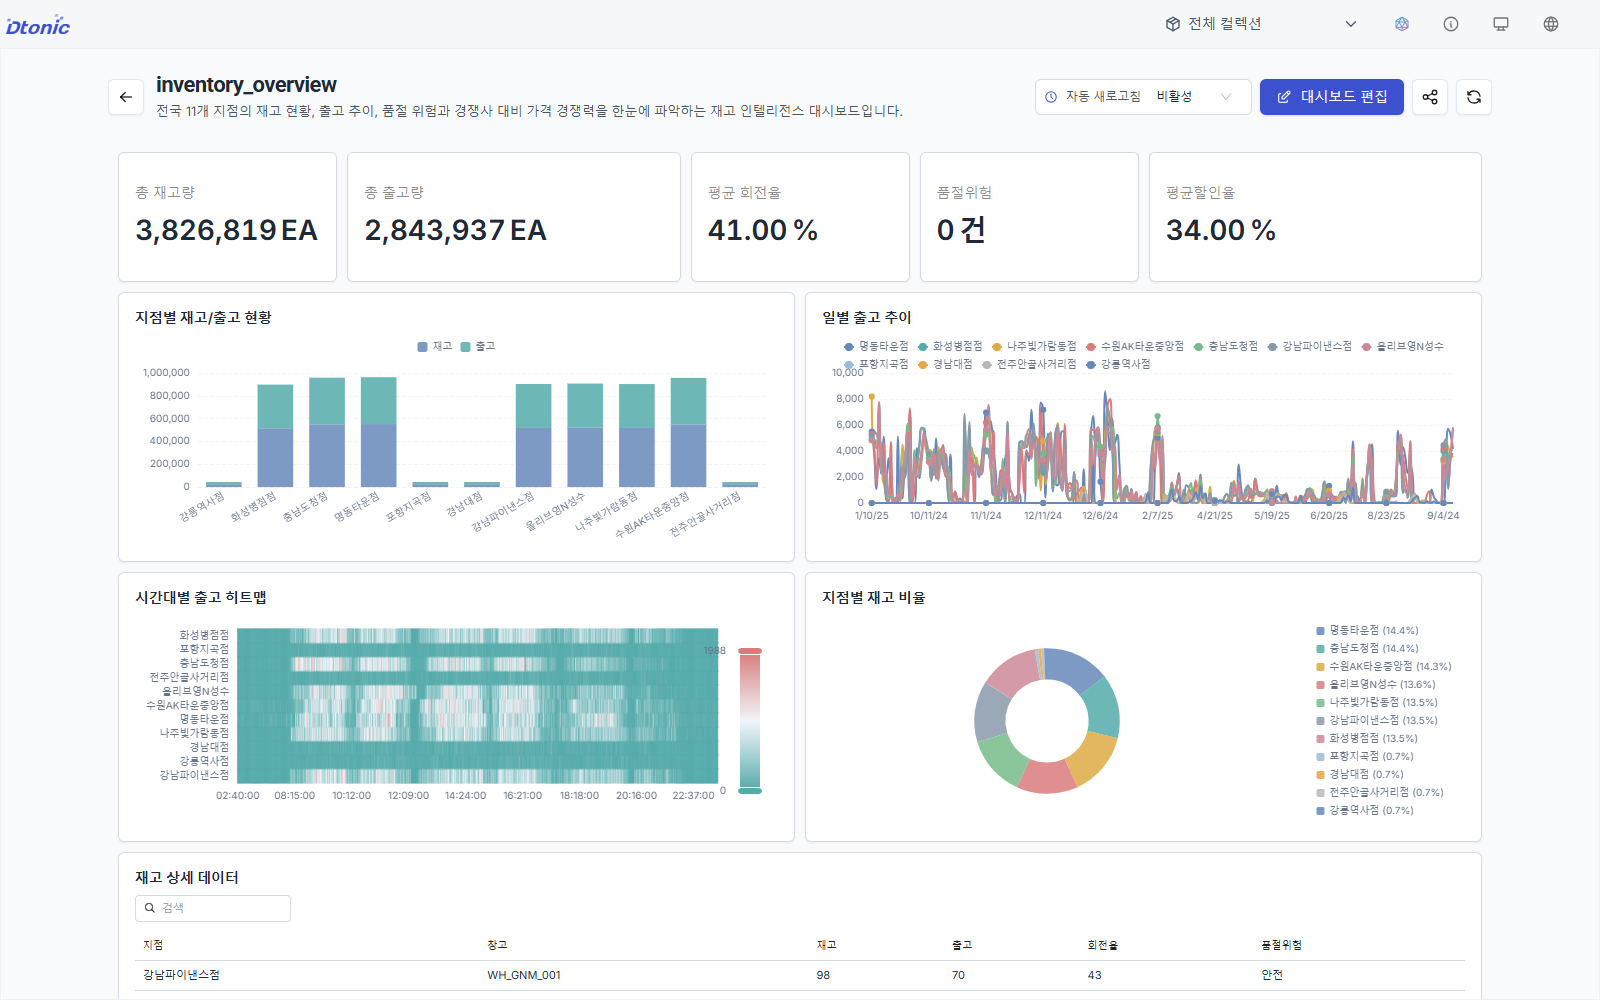
Once the load result is confirmed, open the dashboard editor and connect the data source. Use datasets and ontology entity data to place map, scatter, bar or line chart, and table widgets on the operational screen.
Next lesson
In the next lesson, you register an LLM model and assemble an agent on top of the resources you created.
Before you finish
Use these questions to check whether you achieved this lesson's goal.
- Can you repeat ‘Pipeline build and dashboard visualization’ without following the instructions?
- Can you name at least one place to check when the result differs from what you expected?