Read sensor values together with quality signals
Read value, unit, and quality signal together across 216 sensor rows to separate four explicit high-risk signals from rows that cannot be used at all.
Question for this chapter
Which rows are alert candidates, and which cannot be used in the first place?
Why this matters now
A temperature of 103.7 and a vibration of 4.71 use different units and different normal ranges.
Comparing raw magnitudes judges unlike sensors by one yardstick. Read value, unit,
sensor_type, and quality_flag as one bundle.
A quality signal does two different jobs. It can report that a value left its normal range, or that the sensor cannot produce a value at all. Mixing the two mistakes a broken sensor for a failing machine.
Try it
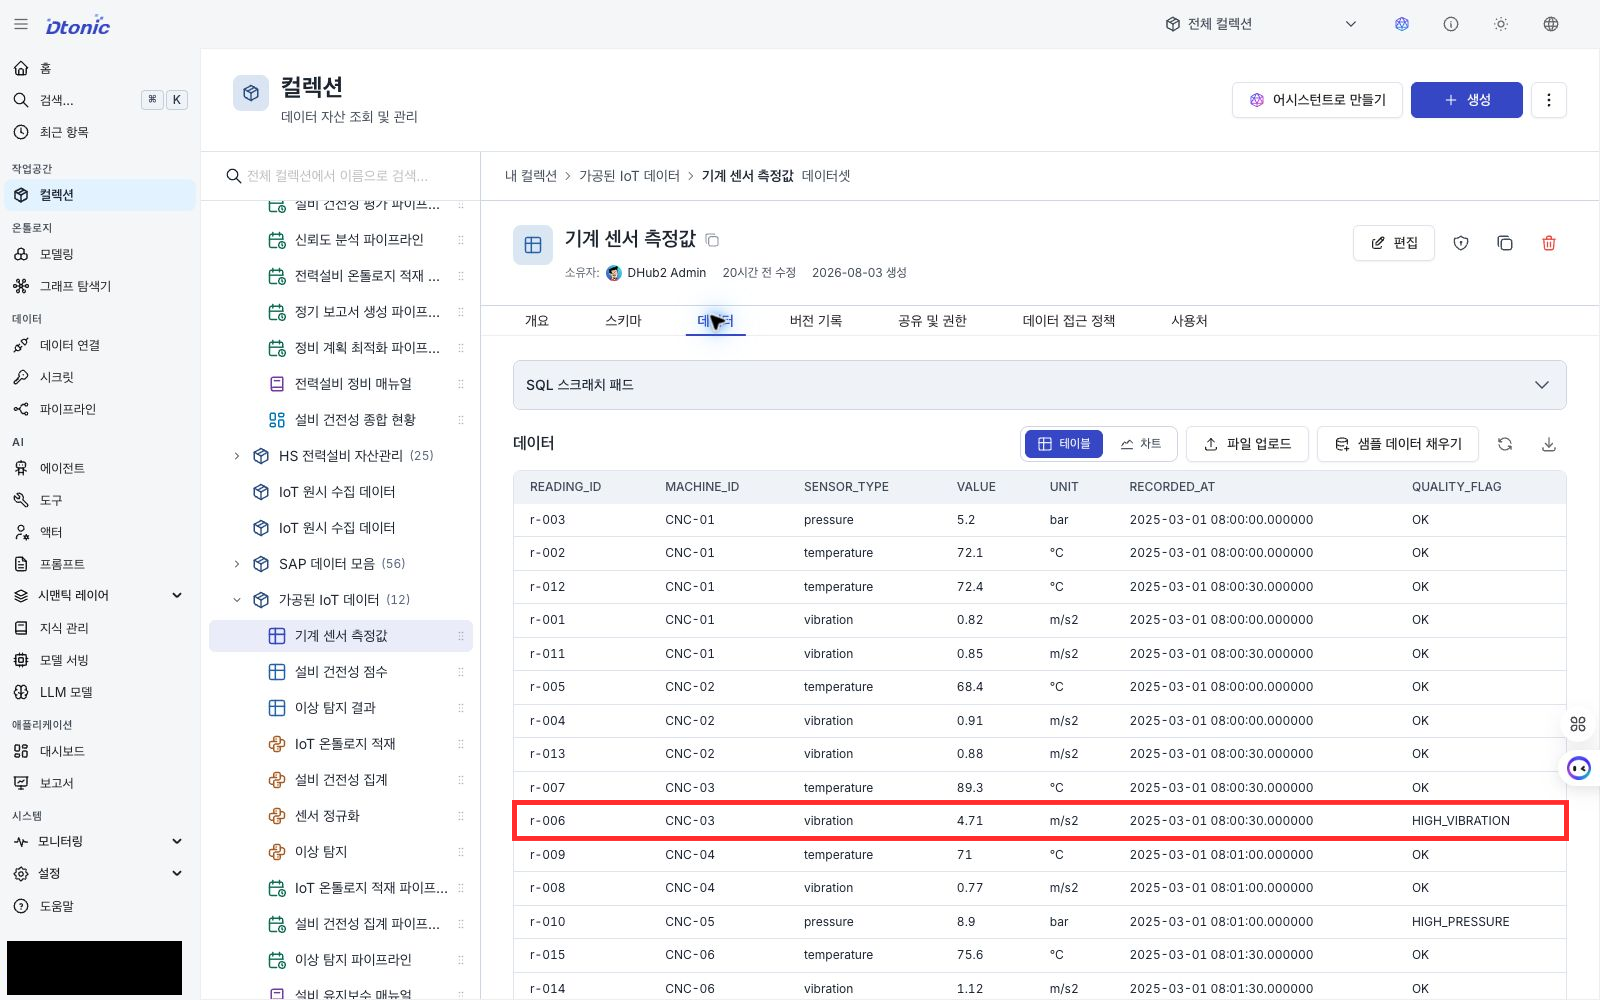
Open machine_sensors (Machine Sensor Readings) in the processed collection, then select
SQL Scratch Pad. Run this query to count rows by quality signal.
SELECT quality_flag, count(*) AS row_count
FROM `processed`.`machine_sensors`
GROUP BY quality_flag
ORDER BY quality_flag;
Next, show only alert candidates, offline sensors, and rows with no value.
SELECT machine_id, sensor_type, value, unit, recorded_at, quality_flag
FROM `processed`.`machine_sensors`
WHERE quality_flag != 'OK' OR value IS NULL
ORDER BY quality_flag, machine_id, recorded_at;
What success looks like
The first query returns five quality signals whose counts add up to 216 rows.
quality_flag | Rows | Meaning |
|---|---|---|
OK | 210 | Normal reading |
HIGH_VIBRATION · HIGH_PRESSURE · HIGH_TEMP | 4 | High-risk condition reported by the source |
OFFLINE | 2 | Sensor cannot produce a value |
The four rows starting with HIGH_ are the starting point for this decision.
| Machine | Sensor | Value | Quality signal | Recorded |
|---|---|---|---|---|
| CNC-03 | vibration | 4.71 m/s² | HIGH_VIBRATION | 03-01 08:00:30 |
| CNC-05 | pressure | 8.9 bar | HIGH_PRESSURE | 03-01 08:01:00 |
| CNC-09 | temperature | 103.7 °C | HIGH_TEMP | 03-01 08:01:30 |
| CNC-07 | temperature | 101.2 °C | HIGH_TEMP | 03-02 08:00:00 |
Interpret the result
These four rows are not inferred from magnitude. The sensor source already reported a condition, so the next chapter's statistical threshold must not override them.
The two OFFLINE rows are a different case. Both come from CNC-09's pressure sensor and their values
are unremarkable at 5.4 and 5.3 bar. But the sensor reported itself as not operating normally, so the
values cannot be trusted. The normalization step in the next chapter filters rows like these out.
Six rows have no value at all: two CNC-04 vibration rows and four CNC-08 pressure rows. Rather than discarding them, normalization carries the previous value forward — but it gives up when a gap runs too long.
Machine configuration is not evidence
There are 27 unique machine_id and sensor_type pairs. All nine machines carry the same three
sensor types — vibration, temperature, and pressure — so configuration alone cannot say which machine
is at risk. The judgment has to come from values and signals.
Next decision
You have separated the four alert candidates from the rows to filter out. Next, learn how a three-sigma check puts every value on one scale, and how explicit quality signals work alongside it. Which zone each machine sits in and who owns it comes from the ontology in chapter 5.